Examples of widget creation - simple widget
Number of security incidents in last 24h - example assumptions
We want to create a widget that displays the number of security incidents in the last 24 hours.
Implementation
- Widgets are created and edited in the menu [Configuration > Widgets].
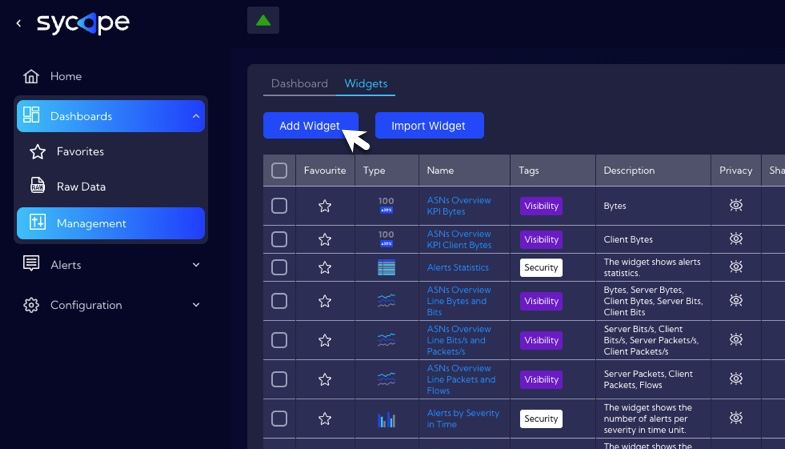
- To add a widget, click on the Add Widget button, then the widget wizard will appear.
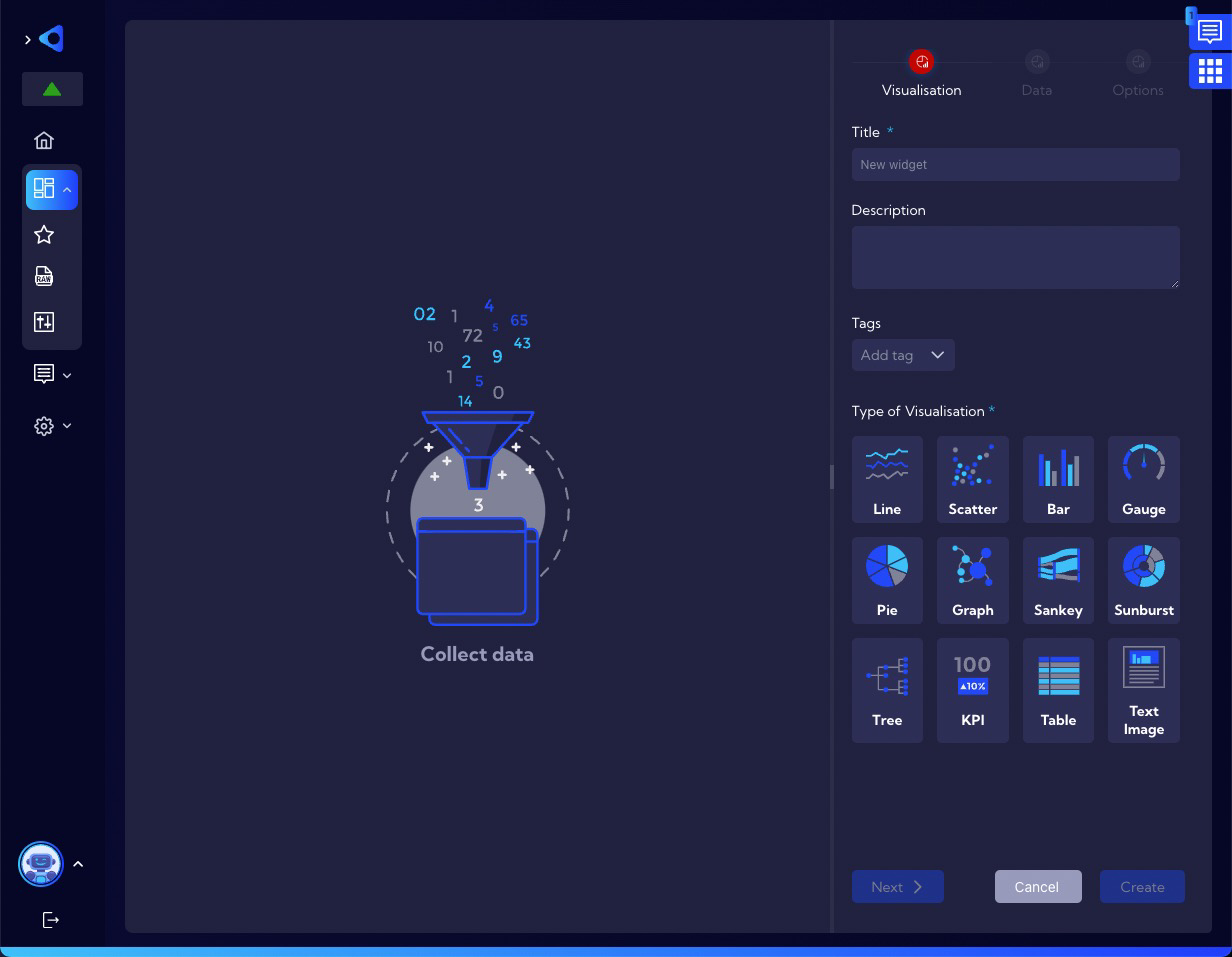
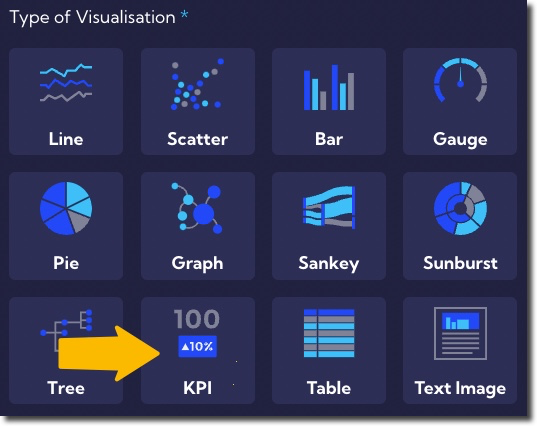
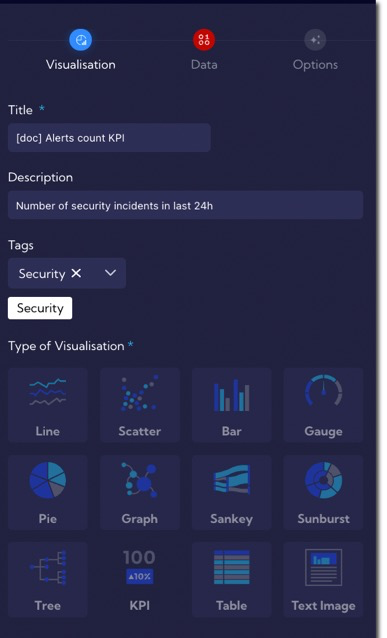
- In the Visualization Tab, enter the name of the Widget in the field Title. In addition to entering a name, you can enter a short description of the Widget in the field Description and assign Tags. Now it is necessary to select the type of visualization you want to use. In this example it will be KPI.
As we know, the widget creation process is divided into three tabs:
- Visualisation,
- Data,
- Option.
- Change the tab to Data.
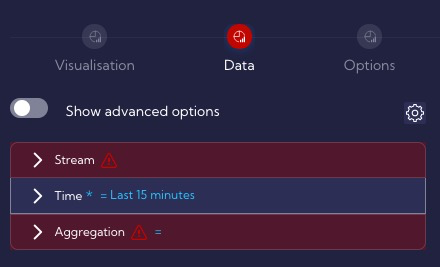
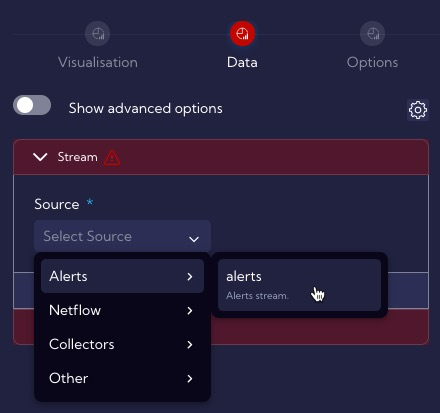
- In order to count the number of alarms, you need to choose a data stream from which such information can be obtained. Information about security incidents are contained in the Alerts stream, which must be selected in the Source field.
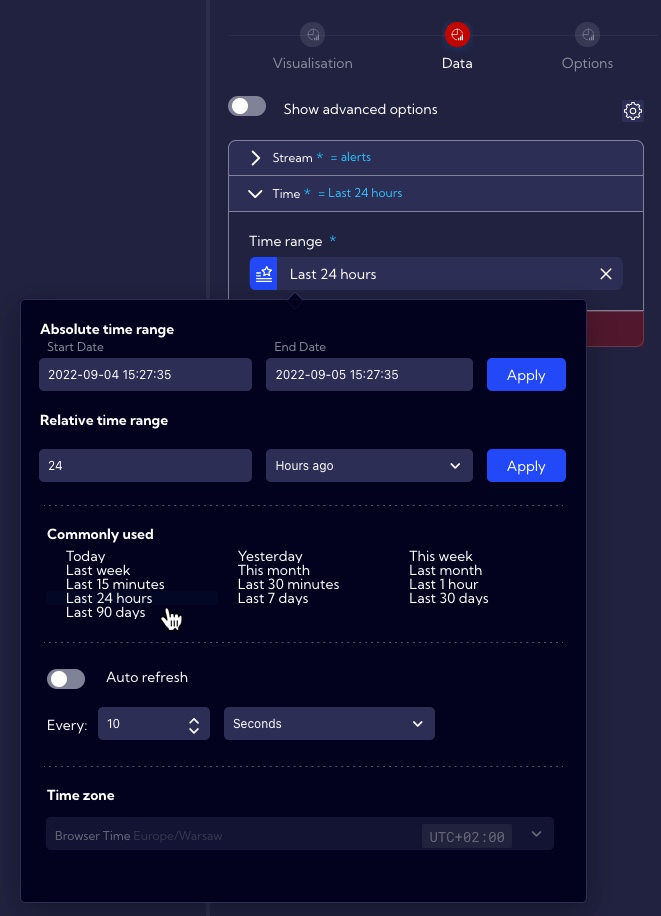
- Specify the time period for which Widget will analyze data - in our example it is last 24h.
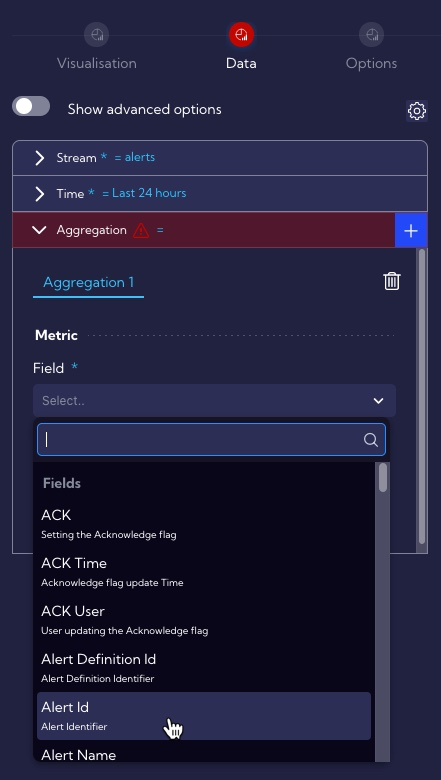
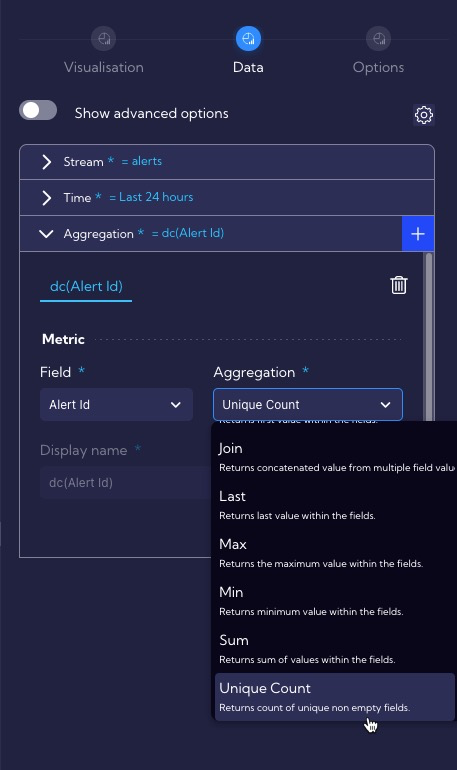
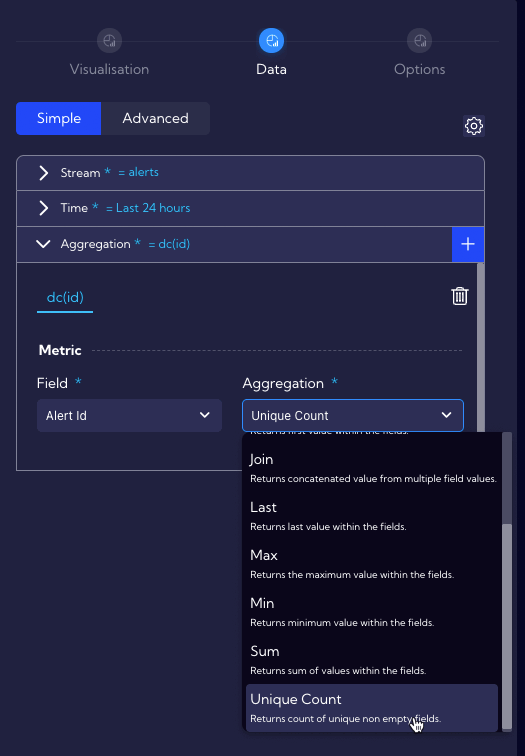
- Define an Aggregation that will allow you to calculate the number of unique alerts that have been generated. To do this, select field Alert id in the Metrics and Unique count in the Aggregation. Alert id is a Field in the Alerts Data Stream that stores the unique id of the alert and Unique Count is an aggregation that returns count of unique non empty fields.
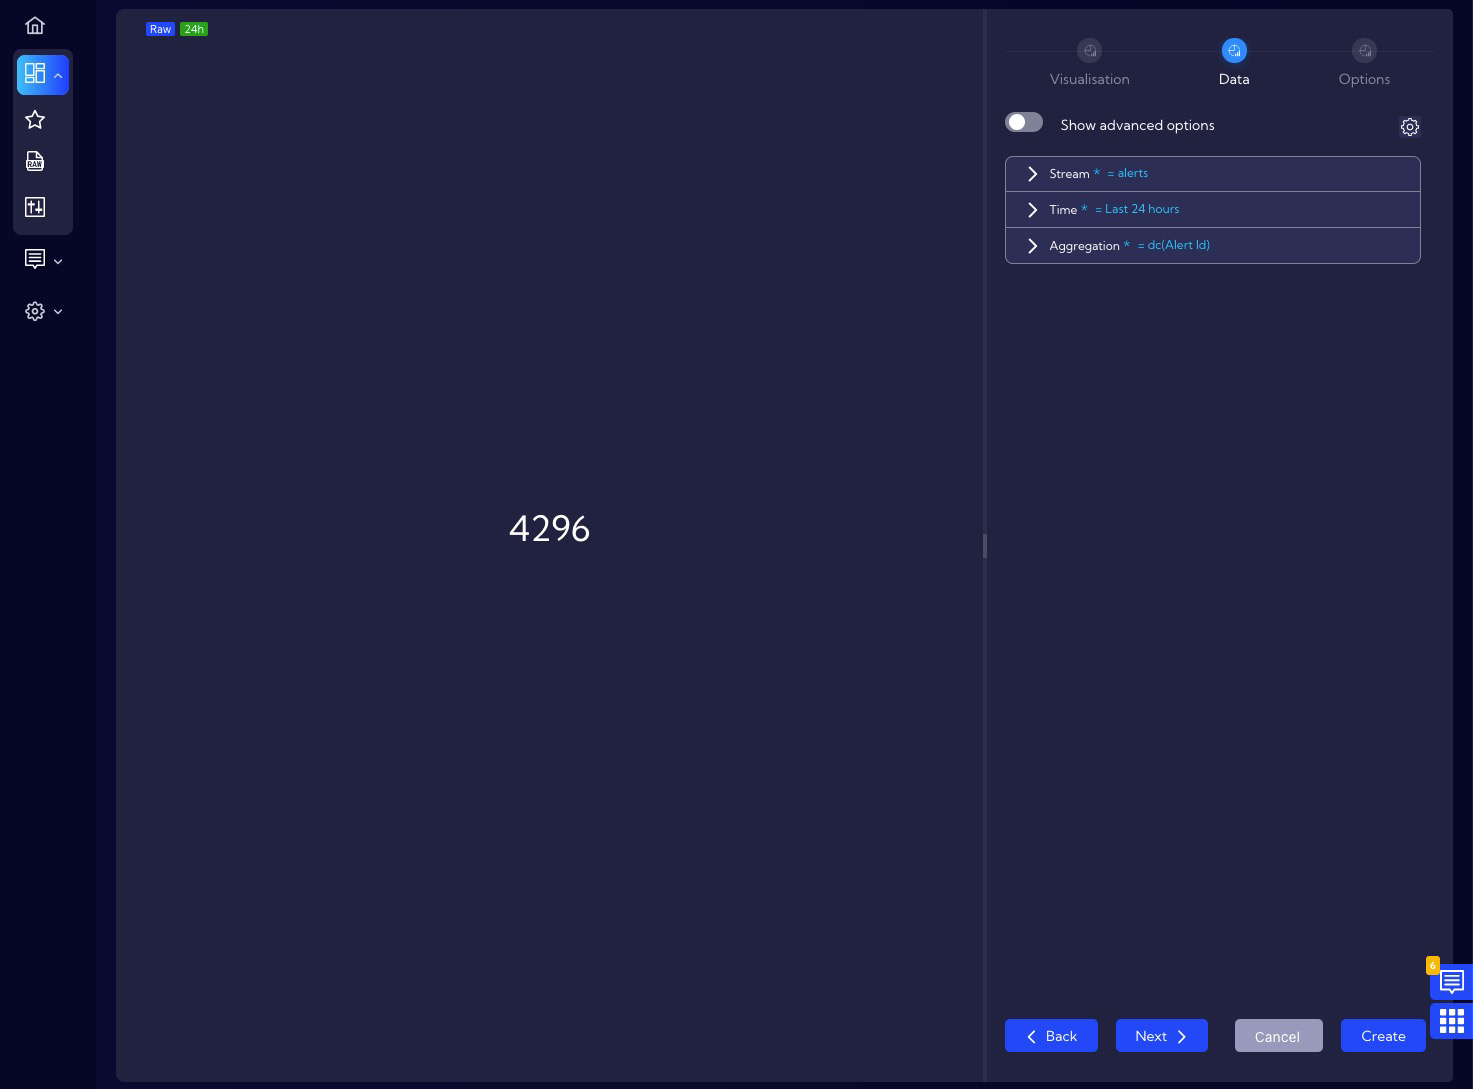
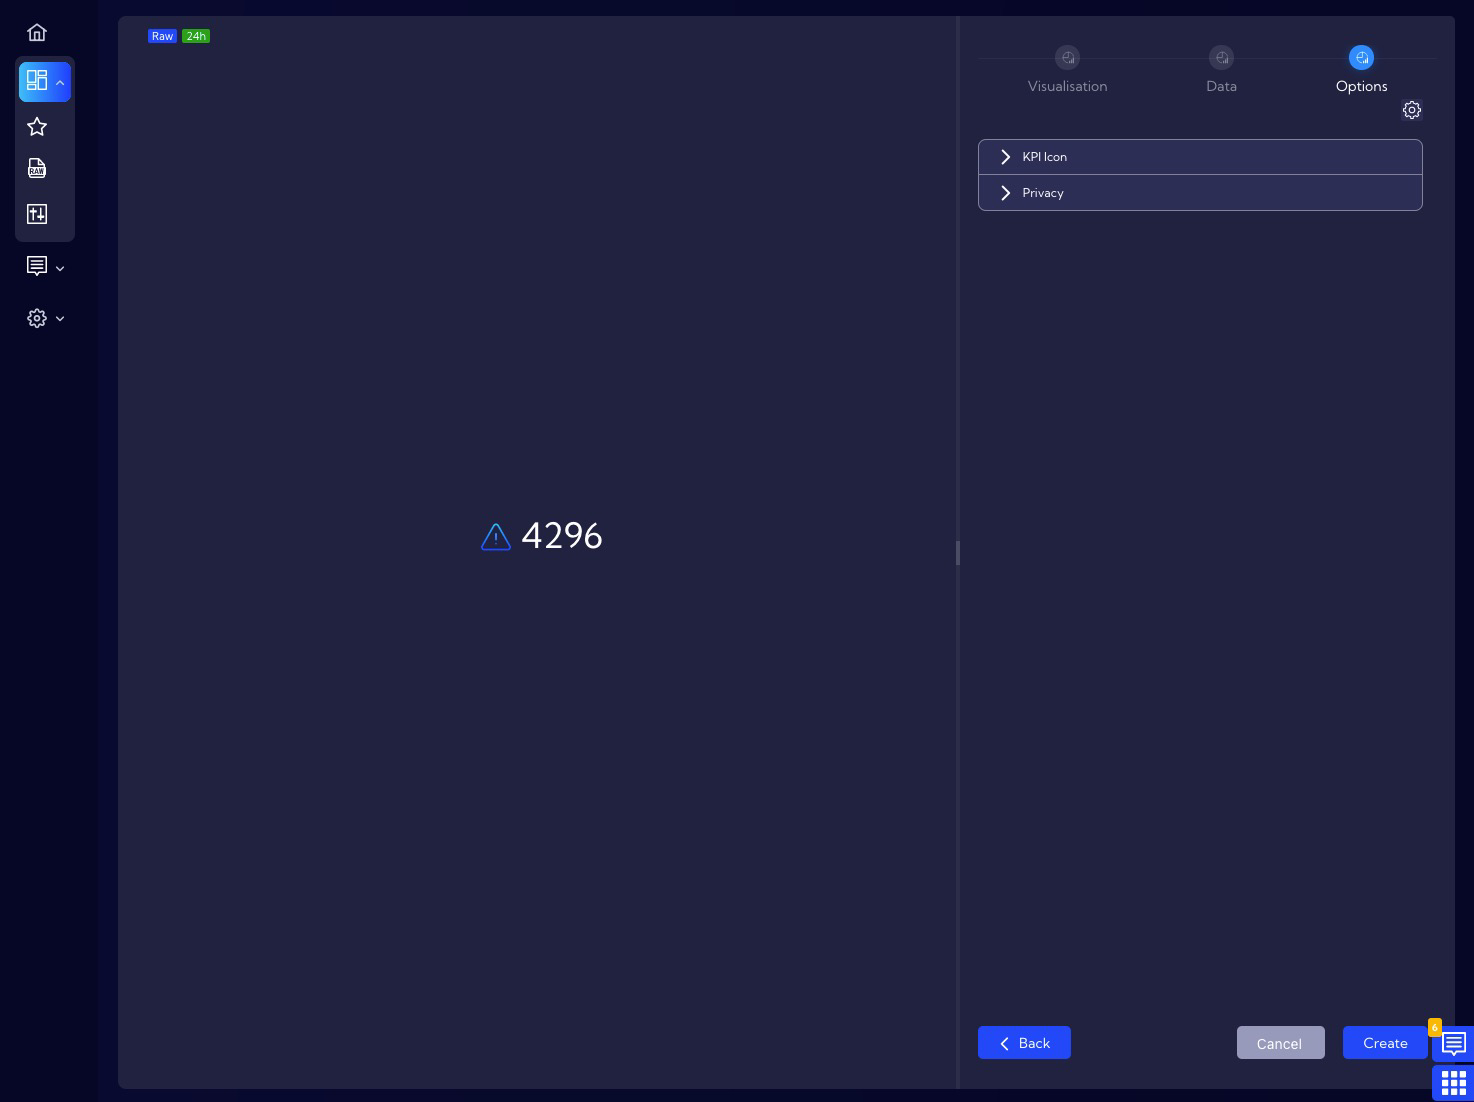
- At this point the widget in its simplest form is almost ready, but it can be edited in various ways to suit individual preferences. As you can see our Widget counted 4296 security incidents in the last 24h. To save the Widget, use the Create button, then it appears on the list of widgets and is ready to be used as part of the Dashboard.
Visual tuning
- Change the tab to the Options and add an icon to the number displayed and to allow other users to launch the widget.
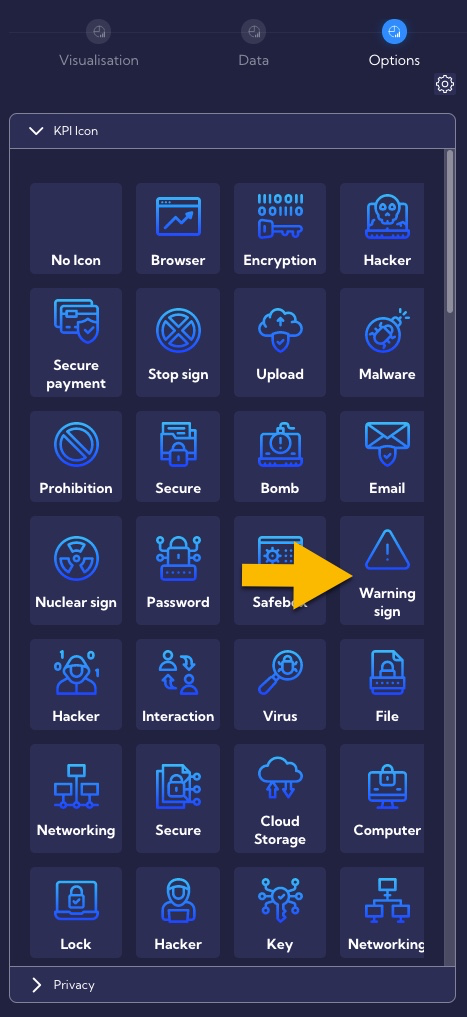
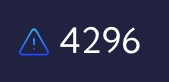
In the KPI icon section there are many icons to choose, in the example let’s choose the Warning sign icon. The result looks like this:
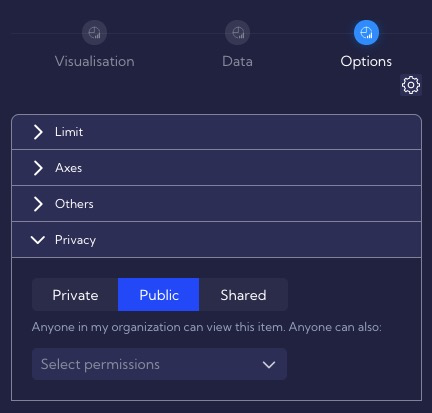
Changing widget permissions
- Change the tab to the Options. By default, the Widget has permission settings as Private.
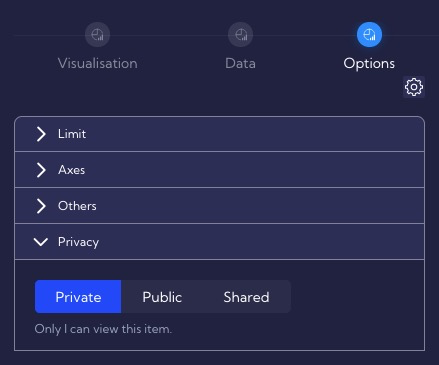
If you want other users to be able to use the Widget, change its permissions to Public.